Simulation results
Some examples of outputs…
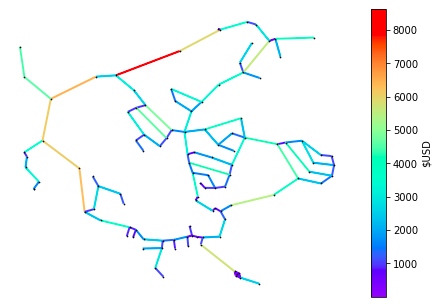
Cost Analysis
Betweenness Centrality

Distance Calculation
Demo: Example Application
- Import SeismoPi dependencies, random seed and read nodes and pipes characteristics, and create model object.
import sp
import numpy as np
import pandas as pd
import networkx as nx
import matplotlib.pyplot as plt
import matplotlib.patches as mpatches
from scipy.spatial import distance
from scipy.stats import expon, lognorm
from sp.Intensity import Intensity
from sp.PFragility import plot_FC
from pyproj import Proj
from pyproj import Proj, transform


# Setup random seed
np.random.seed(100000)

# Read node and link characteristics
node = pd.read_csv('node_demo.csv')
link = pd.read_csv('pipe_demo.csv')
- Define earthquakes
# Define earthquake characteristics and select appropriate coordinate systems
inProj = Proj(init='epsg:3857')
outProj = Proj(init='epsg:4326')
x1,y1 = (2438165, 369184)
ex,ey = transform(inProj,outProj,x1,y1)
ex,ey


# Define expicenter coordinates (check with above command)
ex=-13589706.28220519; #this is longitude of the epicenter
ey=4592436.47339457; #this is latitude of the epicenter
M=7 # Richter Magnitude
- Create Models and PGA estimates
# Transform coordinates to utm
rx,ry=sp.estimate.tran(node)
node_id = list(node.id)
rx = list(rx)
ry = list(ry)
typ = list(node.type)
dn1 = {'id':node_id,'x':rx,'y':ry,'type':typ}
df1=pd.DataFrame(dn1)
node=df1
# Distance Check and Measure Length of Links
L1=df1.x[3],df1.y[3]
L2=df1.x[5],df1.y[5]
dist = distance.euclidean(L1, L2)
print(dist/1000, "km")
link['link_m']=list(sp.estimate.Length(node,link))
### Classify and plot various components
# node types
a = node[node['type']==1]
b = node[node['type']==2]
c = node[node['type']==3]
# pipe types
p1 = link[link['type']==1]
p2 = link[link['type']==2]
# calculate distances,intensity from epicenter
r1, pga1, pgv1, pos1 = sp.Intensity.intensity_node(a,ex,ey,M)
r2, pga2, pgv2, pos2 = sp.Intensity.intensity_node(b,ex,ey,M)
r3, pga3, pgv3, pos3 = sp.Intensity.intensity_node(c,ex,ey,M)
# plot graps with various components
G1=nx.Graph()
G1.add_nodes_from(pos1)
G2=nx.Graph()
G2.add_nodes_from(pos2)
G3=nx.Graph()
G3.add_nodes_from(pos3)
nx.draw(G1,pos1,node_size=20,node_color='r',with_labels=False)
nx.draw(G2,pos2,node_size=20,node_color='b',with_labels=False)
nx.draw(G3,pos3,node_size=20,node_color='g',with_labels=False)
r, pga, pgv, pos = sp.Intensity.intensity_node(node,ex,ey,M)
d1 = []
for index, row in p1.iterrows():
stt = str(row['start_node'])+str(row['end_node']).rjust(10)
d1.append(stt)
d2 = []
for index, row in p2.iterrows():
stt = str(row['start_node'])+str(row['end_node']).rjust(10)
d2.append(stt)
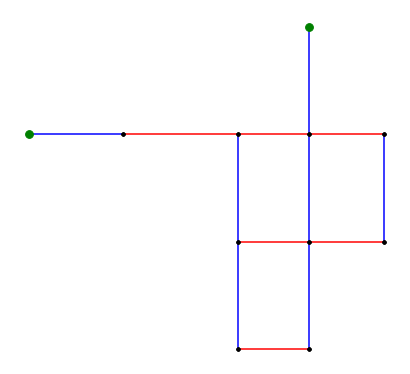
# draw Graph of water network
G4 = nx.parse_edgelist(d1,nodetype=int)
G5 = nx.parse_edgelist(d2,nodetype=int)
nx.draw(G4,pos,node_size=10, node_color='k', edge_color='r',width=1.5)
nx.draw(G5,pos,node_size=10, node_color='k', edge_color='b',width=1.5)
nx.draw(G1,pos1,node_size=10,node_color='k',with_labels=False)
nx.draw(G2,pos2,node_size=10,node_color='k',with_labels=False)
nx.draw(G3,pos3,node_size=60,node_color='g',with_labels=False)
plt.savefig('Network.png', dpi = 600,bbox_inches='tight')